After logging into DCImanager 6, you will be taken to the Servers section. The section displays all the servers that you own. You can sort the data in the server table and customize its display by a specified filter. You can view detailed information and make changes to the settings in the server dashboard.
Sorting and filters
There are two options for sorting information in the tables — by the device ID or name. For example, to sort the servers list, go to Servers → Server name → choose the sorting parameter: Server name or ID.
You can set a filter for display of server details. The server name, its ID, main IP address, MAC address can be used as filter criteria.
To enable server filtering by name or ID, go to Servers →  in column Server name → choose the filter type: ID or Server name → specify comma separated filter values. Only a part of server name can be entered. For example, to display filters with name "Server40", "Server41", "Server50", "Server51", enter "Server4, Server5".
To enable server filtering by IP or MAC address, go to Servers →  in column Primary IP/MAC → choose the filter type: IP or MAC → specify comma separated server IP or MAC addresses. Only a part of server address can be entered. For example, to display servers from networks 192.168.1.0/24, 192.168.2.0/24, enter "192.168.1, 192.168.2".
Operations with server
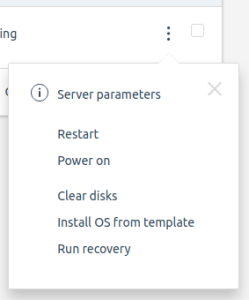
To perform operations with servers, press  in the server name line and choose the required operation. These operations can also be performed from the server dashboard. Available operations:
- turn on/turn off/restart the server;
- cleaning server disks;
- operating system installation;
- start/stop recovery mode.
Server operations menu
The administrator can put the server into maintenance mode. While the server is in this mode, operations on it are not available. Servers in maintenance mode are displayed with the

icon in the Status column and the message "In admin maintenance mode" in the server card.
Server dashboard
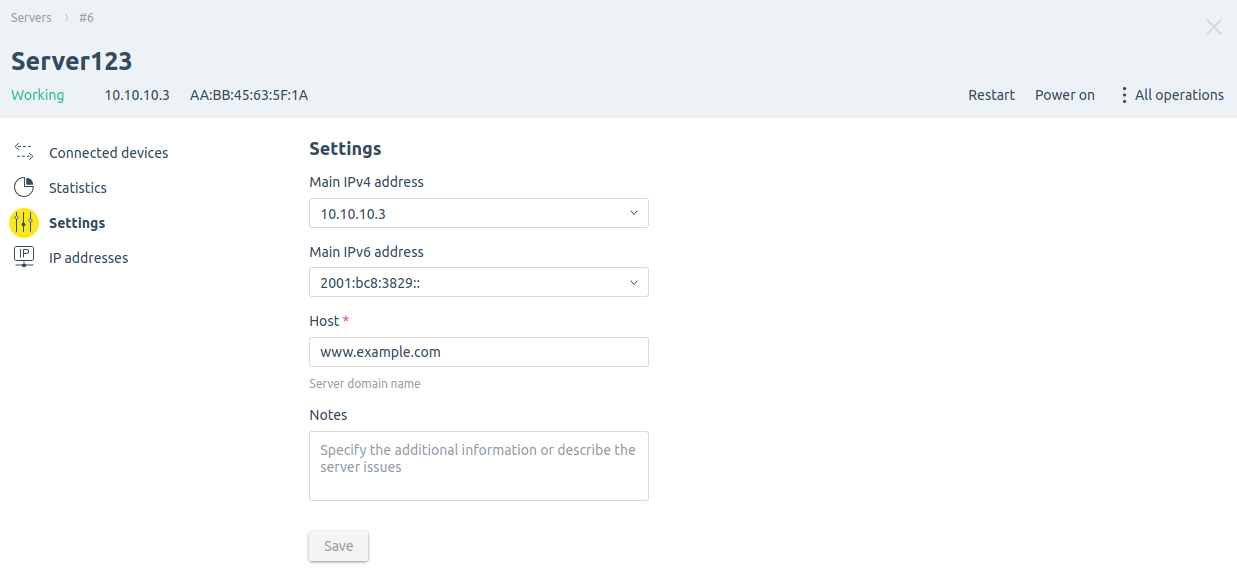
The dashboard provides details of the server, its settings and statistics.
To open server dashboard, go to Servers → choose the server →  menu → Server parameters.

Server dashboard interface
 En
En
 Es
Es
