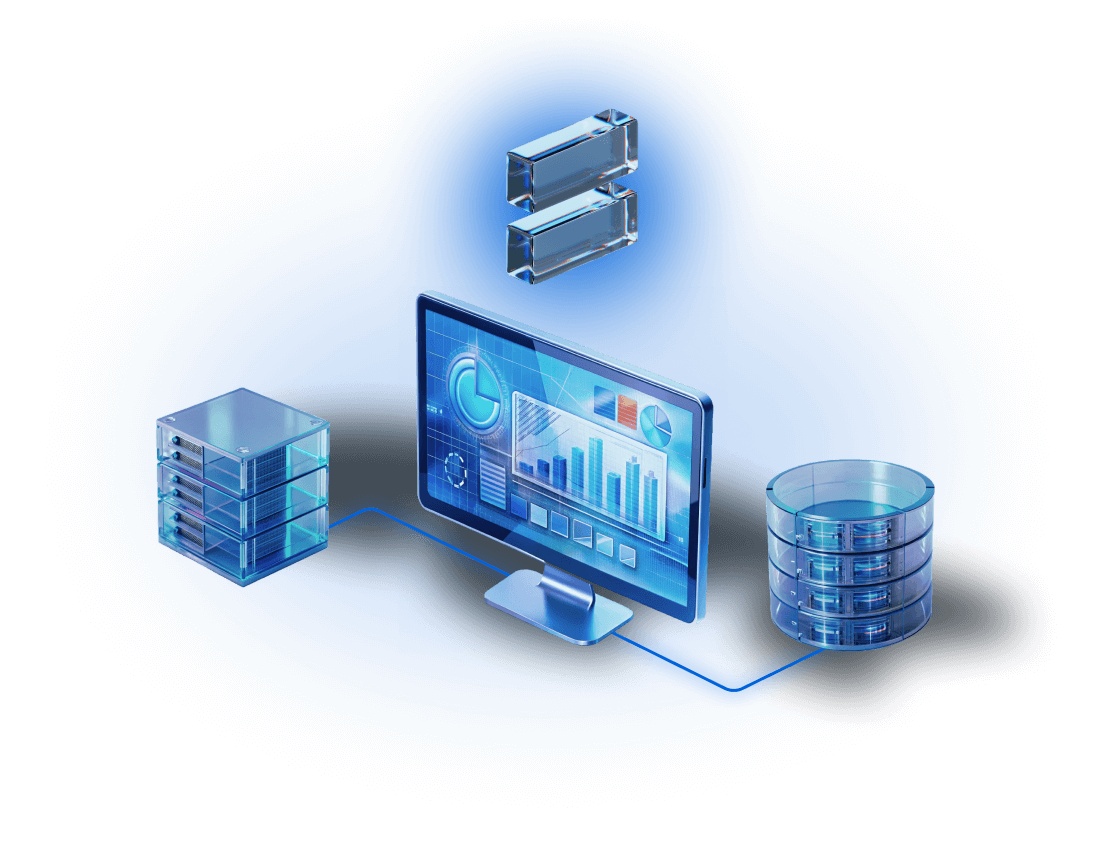
Collection, monitoring and visualization of server statistics
Collection, processing and visualization of statistics on the operation of server and server-side equipment

Key features
Comprehensive monitoring
Collecting statistics from servers, switches, PDUs and UPS every 5 minutes. Monitoring traffic, energy consumption and other parameters
Built-in tools
Clickhouse — for collecting and storing statistical data, Grafana — for visualization, monitoring and analysis of data
NetFlow Statistics Collection
Collection of network traffic statistics in a location using the NetFlow protocol and the sFlow industry standard
Convenient visualization
Data visualization in the platform interface and access to the Grafana web interface
Collection of statistics in DCImanager
To process statistics, the DCImanager platform uses a built-in service for working with equipment and third-party tools:
- Clickhouse - for collecting and storing statistical data;
- Grafana – for data visualization, monitoring and analysis.
Statistical data is updated every 5 minutes. You can view statistics for a day, week, month, year, or a selected interval in the device card (server, switch, PDU, UPS).
Users of Aquarius equipment have the opportunity to receive data from the BMC chip within the operating system when they purchase an OEM solution.
Server hardware statistics
The platform collects statistics on server energy consumption and traffic. Power consumption information is collected from the PDU ports to which the server is connected. Traffic data can be collected in two ways: from the ports of a connected switch or via the Netflow protocol.
Switch statistics
DCImanager collects data about traffic entering and exiting the switch. The platform tracks several parameters at once:
Traffic volume;
Channel load.
PDU statistics
The platform collects statistics on the energy consumption of Power Distribution Unit (PDU) class devices. Statistics for C3 Solutions and RPCM devices are available with distribution by ports.
UPS Statistics
DCImanager collects statistics on the operation of uninterruptible power supplies. The platform tracks several parameters:
Battery charge;
Load;
Power consumption;
Output power.
Data visualization
All collected data is visualized using Grafana. The DCImanager interface provides clear and convenient graphs. If necessary, you can go to the Grafana web interface.
Why is it necessary to visualize statistical data?
Simplifying the analysis
Visualization turns complex and voluminous data into graphs and makes them more understandable and accessible for analysis. This is especially important for quickly identifying trends, anomalies and patterns.
Improving the efficiency of decision making
With data clearly presented, administrators can make decisions faster and more accurately. Visualization helps you see the big picture and understand what actions need to be taken to improve the system's performance.
Forecasting and planning
Data visualization allows you to use historical data to predict future trends and needs. This helps in resource planning and preventing potential problems before they arise.
DCImanager Hosting tariff
Solution for automating dedicated server sales
- Automatic provisioning of ready-to-use servers
- Equipment diagnostics during client changes
- Automation of Colocation service
- Self-service portal for clients
- Integration with billing platforms
- Additional service monetization through built-in modules
for "Warehouse" module

about the platform
Detailed video about platform capabilities

a demo
Personal platform demonstration for customer staff. The demo is conducted by implementation team experts
management
platforms
Get demo access to experience ISPsystem solutions in action:
- Try the user-friendly interface designed for users with varying technical skills
- Explore automation, monitoring, and billing capabilities
- See how ISPsystem solves IT management challenges and optimizes costs
DCImanager Hosting tariff
Solution for automating dedicated server sales
- Automatic provisioning of ready-to-use servers
- Equipment diagnostics during client changes
- Automation of Colocation service
- Self-service portal for clients
- Integration with billing platforms
- Additional service monetization through built-in modules
for "Warehouse" module

about the platform
Detailed video about platform capabilities

a demo
Personal platform demonstration for customer staff. The demo is conducted by implementation team experts