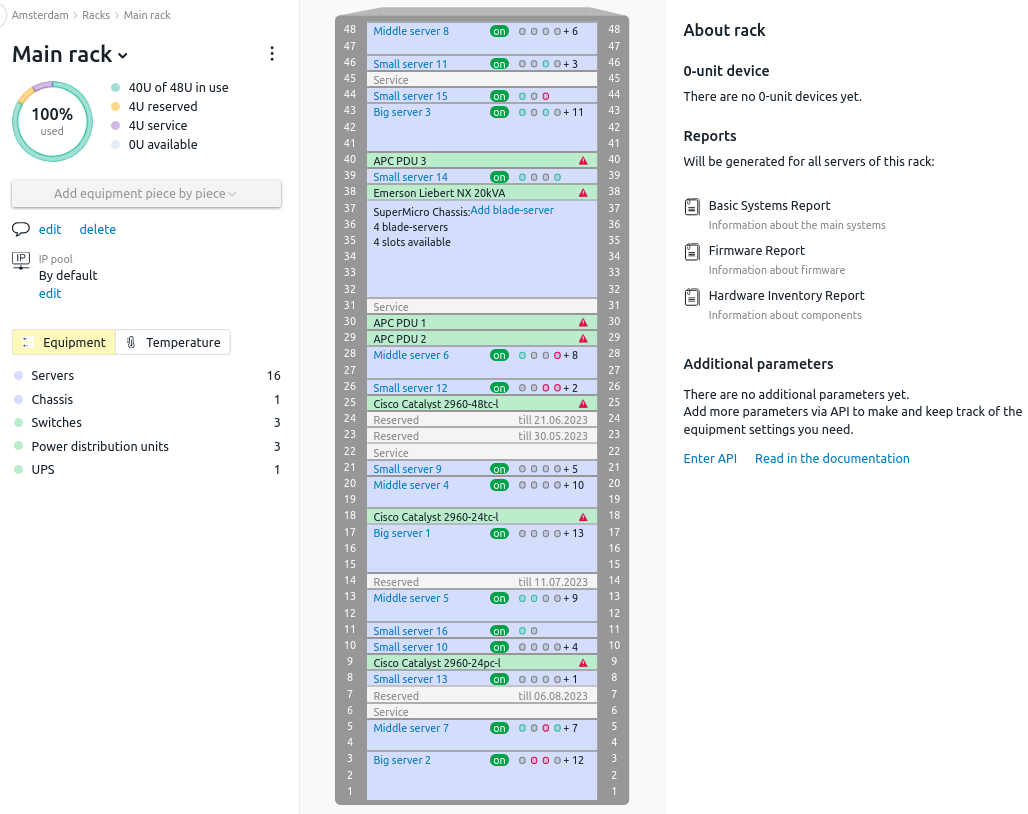
The Rack Visualization module displays the rack map graphically. The interface of the module allows you to see:
- equipment location;
- number of devices of a certain type;
- number of free, occupied and reserved units;
- devices allocated to the rack;
- rack load percentage;
- server temperature in the rack.
Buying and installing the module
To use the module:
- Go to your client area at eu.ispsystem.com:
- Open your DCImanager 6 license settings.
- Enable the Rack option.
- Click Save changes.
-
Update your DCImanager 6 license information: in the right menu click
 → System overview → Update license information.
To install the module, in the right menu click  → Modules → Rack visualization → Install button.
Module interface
To work with the module, go to the Racks section and select the required rack.
Left part of the window
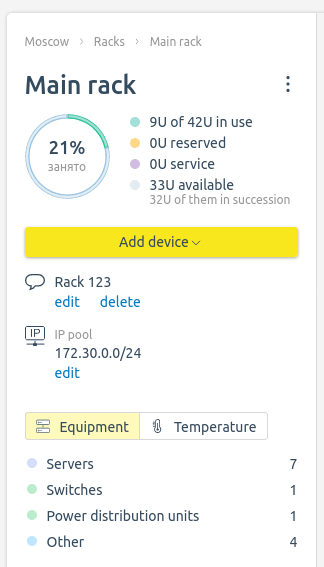
The left part of the window contains general information about the rack:
- rack name;
- number of occupied and free units;
- number of service units - units to which equipment cannot be added;
- number of reserved units - units to which equipment cannot be added until a certain date;
- number of adjacent free units;
- rack occupancy percentage - what percentage of units are occupied, reserved or marked as service units;
- comment to rack;
- pools from which IP addresses are allocated to the servers in the rack;
- rack weight in kilograms;
- quantity of each equipment type.
On the left side of the window, you can switch the display mode of the rack:
- Equipment — the rack map displays information about devices;
- Temperature — the rack map displays information about the temperature of the servers.
To switch to another rack, click on the name of the current rack and select the desired one from the list.
Middle part of the window
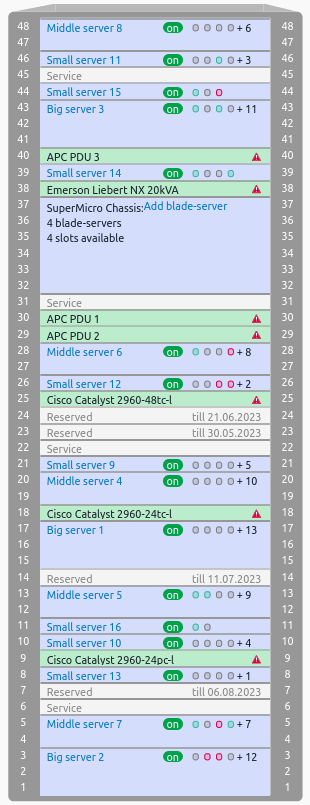
The middle part of the window contains the rack map. You can switch between Front, Rear, or Both sides view. The background color of each unit depends on the type of equipment placed:
-
 — server or a сhassis;
 -
 — switch, PDU or UPS.
Equipment that occupies an entire unit in depth will be displayed on both sides of the rack. Equipment that occupies half a unit in depth will only be displayed on the side to which it is added.
Equipment power status is displayed to the right of the device name:
- on — the device is on;
- off — the device is off;
- n/a — the status is undefined.
Service and reserved units of the rack are marked with the  icon. The servers have network interface
  icons to the right of the device name.
If an error is detected in the operation of the device, the  icon appears in the unit.
Right part of the window
The right part of the window contains:
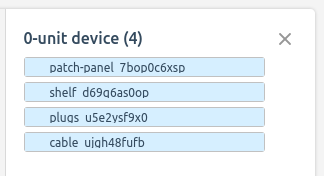
- information about devices that are not placed into the rack, but allocated to it. For example, floor-mounted UPS units or vertical PDUs. The background color of the device depends on the type of equipment placed:
-
 — switch, PDU or UPS;
 -
 — equipment with the type "Other" added from Inventory management module.
-
- links to generating reports by servers in a rack. Read more in the Reports.
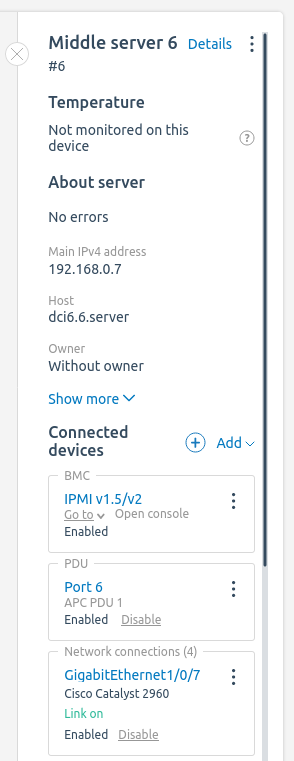
If a device is highlighted in the rack map, then the right side of the window displays information block about that device. In this block you can:
- manage the device connections;
- perform operations with the device through the
 menu .
Temperature monitoring
To display server temperature data in the rack map, configure server BMC connection and equipment status alerts .
To enable the display of monitoring data, press Temperature on the left side of the module window. The colors of the units will change depending on the status:
-
 — server temperature is out of range for the specified time or longer;
 -
 — server temperature is out of range for less than the specified time;
 -
 — server temperature is within the range;
 -
 — temperature data is not collected.
For example, the platform administrator has configured a setting for the "Temperature out of range for 15 minutes" notification. If the BMC poll shows that the temperature has been exceeded, the color of the unit will change to orange. If the temperature does not decrease to the permissible value within 15 minutes, the color of the unit will change to pink.
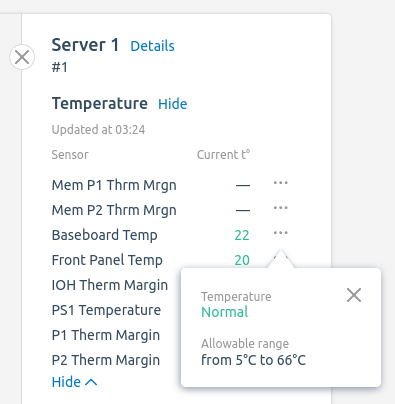
To view the temperature values, highlight the server in the rack map and go to Temperature → Details on the right side of the module window. To see the permissible value range for a particular sensor, click  next to the temperature value.
Managing racks
Connecting the equipment
To add equipment to the rack, enter Add device → New equipment → select the equipment type → Next . You will be redirected to the form for adding equipment of the selected type.
To add a server from a warehouse, go to Add device → Server from the warehouse → select a server → specify its parameters → Put the server into operation.
To add a blade server to the chassis, press Add blade server in the required unit.
Reservation of units
To reserve rack units, enter Add device → Reserve units :
- Select Units .
-
Specify the Reservation period .
The reservation period is only used for display in the rack card. To remove it, you must cancel the reservation manually. - Add a discretionary Note .
- Press Add. The selected units will be unavailable for adding equipment.
To cancel a unit reservation, select the unit and press Cancel reservation on the right side of the window.
Service Units
To mark rack units as service units, enter Add device → Mark as service units:
- Select Units.
- Specify an arbitrary Unit Name.
- Specify an arbitrary Note.
- Click Mark as service. The selected units will be unavailable for adding equipment.
To make the unit available for adding equipment, select it in the rack map and press Unselect "Service Unit" on the right side of the window.
Unit menu
You can perform operations through the unit menu. To do this, mark the unit and select the action:
- Add new equipment;
- Add a server from the warehouse;
- Reserve units;
- Mark as service.
Editing rack parameters
To edit the rack parameters, enter the  menu → Edit :
- Enter the Rack name or number.
- Select the Height of the rack in units.
- Select the IP pool for the servers in the rack.
- If needed, enter the Weight in kilograms.
- Add a discretionary Note.
- Press Save.
To delete a rack, enter the  menu → Delete rack .
 En
En
 Es
Es