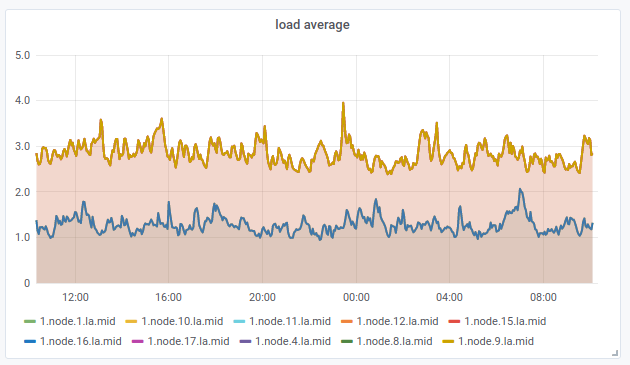
VMmanager includes the monitoring visualization system Grafana. Grafana is used to visualize metrics collected from cluster nodes and virtual machines.
With the Grafana information panels (dashboards) you can:
- configure the display of metrics as charts and graphs;
- track changes in metrics over time;
- configure automatic notifications to messengers. Read more in Grafana. Configuring notifications.
Read more about Grafana in the official documentation .
How to open Grafana interface
Grafana's web interface is available at URL https://domain.com/vm/grafana.
To enter Grafana's web interface from VMmanager, in the right-hand menu click  → Grafana.
VMmanager dashboard
VMmanager creates a dashboard in Grafana with cluster node metrics:

Node cluster metrics have the name in the format: 1.node.<node_id>.<node_metric>.
To monitor the required metrics of cluster nodes and virtual machines, we recommend setting up your own dashboard in Grafana. Read more in Grafana. Configuring a user's dashboard.
 En
En
 Es
Es