The BILLmanager dashboard is a platform monitoring tool. The page consists of a quick access panel and widgets with information about:
- sales dynamics;
- sales by provider;
- sales by period;
- work of technical support;
- potential cost of services;
- services as of a specific date;
- tasks and operations;
- balance of services for resale;
- actual turnover for the selected period.
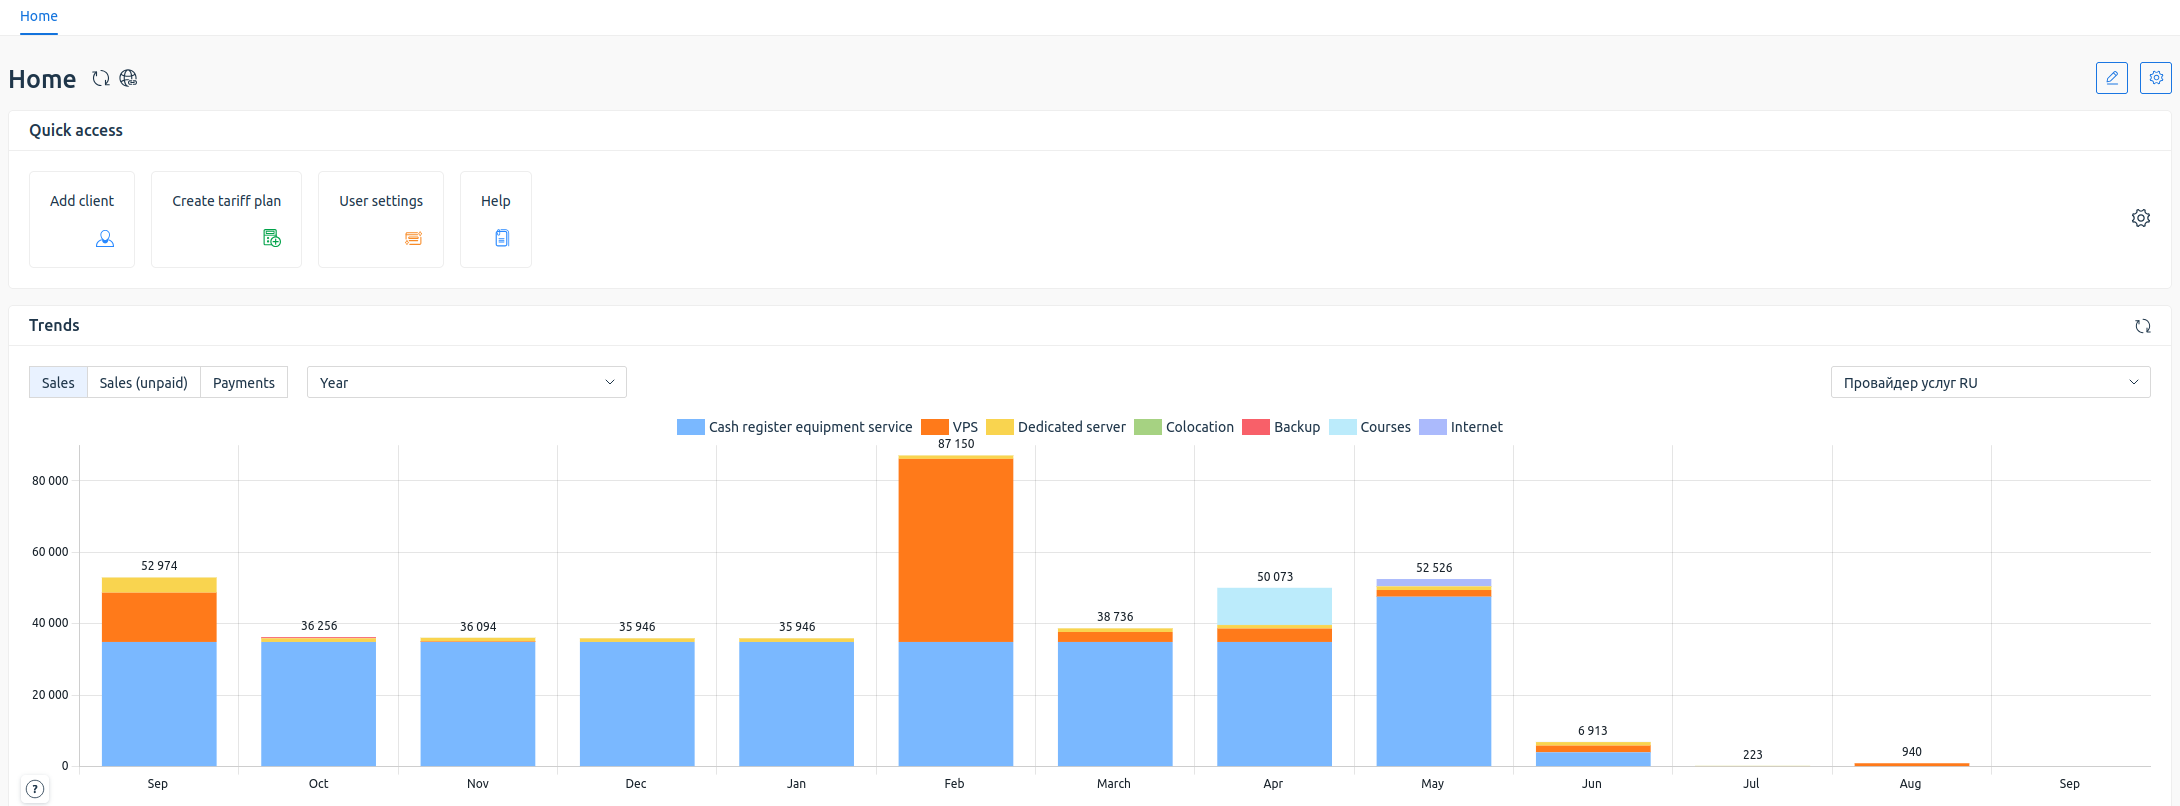
Dashboard interface
To open the dashboard, click the Home button at the top of the screen.
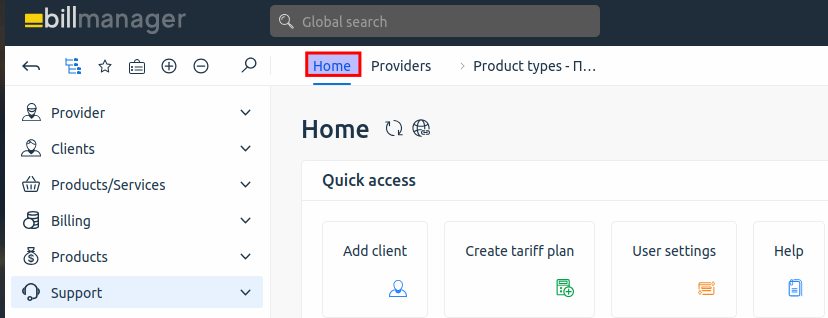
Dashboard management
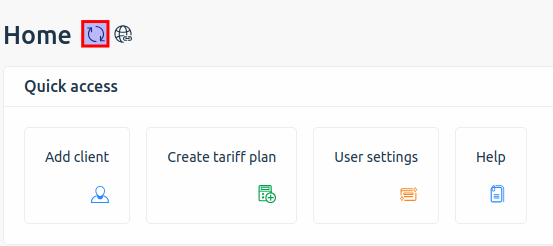
Updating dashboard information
To update the dashboard information, click the  icon on the top line next to the header. In some cases, the updated data may appear with a delay.
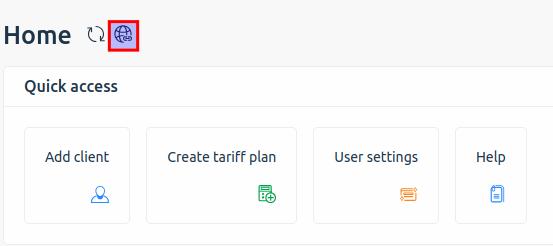
Providing a link to a dashboard
To share a link to a dashboard, click the  icon in the top line next to the title.The link will be copied to the clipboard.
Editing widgets
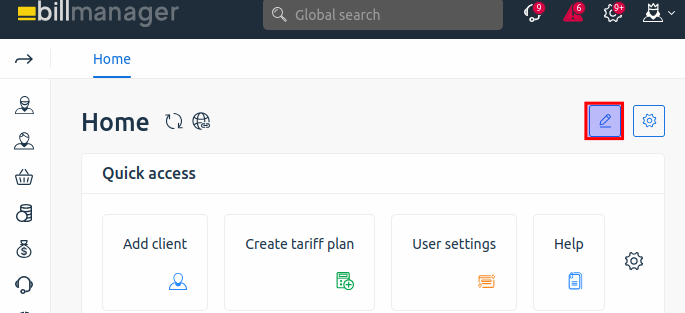
To change the location of widgets, click the  icon in the top right corner.
This will open the edit mode. This mode enables you to:
• move widgets;
• remove widgets from the home page.
To change the position the widget, drag and drop it to the preferred location on the screen.
To remove a widget from the home page, in edit mode, click the  icon in the top right corner of the widget:
The widget location can be reset using the add and hide settings.
To exit edit mode, click the  icon again.
Adding or hiding widgets
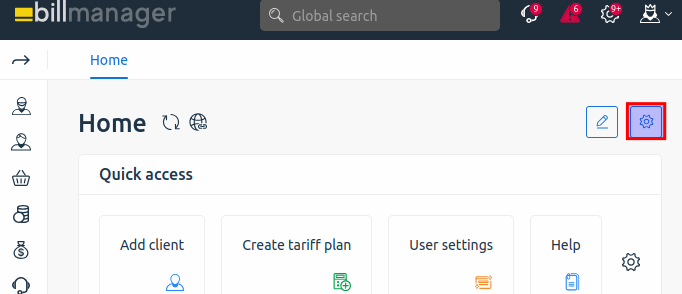
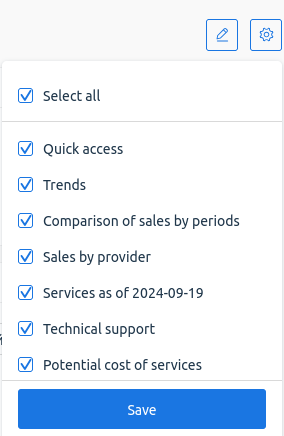
To hide or add widgets:
2. Select the widgets you need to add.
Update widget information
To update widget information, click the  icon in the upper right corner. In some cases, updated data may appear with a delay.
Quick access widget
The widget allows users to quickly find and use the features they need. Users can customize the widget interface to their needs and add specific features.
The following features are available by default:
- Add client;
- Create a tariff plan;
- User Settings;
- Help.
To add options to the widget:
1. Click the  icon.
icon.
2. Select the required features.
3. Click Save button.

Default widget interface
Trends widget
Widget displays changes in sales volumes by product type for a selected period of time. Annual and all-time statistics are available. If you select the "Year" period, statistics for the last 13 months will be displayed. For example, in September 2024, statistics from September 2023 to September 2024 inclusive will be displayed. Selecting "The whole period" displays statistics for the entire sales period.
Charts are available for:
- sales;
- unpaid sales;
- payments.
To see a chart of changes, click on its name.
By default, widget displays all types of services. To exclude an indicator from the statistics, click on its name. Excluded indicators will be displayed strikethrough. To restore the excluded indicator, click on its name again.
Widget shows a view of statistics for a specific provider. The list of providers is available in the drop-down menu in the upper right part of the widget.

Widget interface
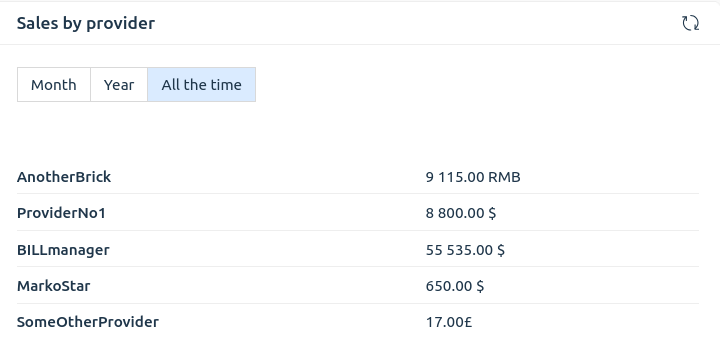
Sales by provider widget
The widget contains a table with data on sales by providers for a month, a year and for all time. The statistics is displayed in the currency specified in the settings of each provider.
Widget interface
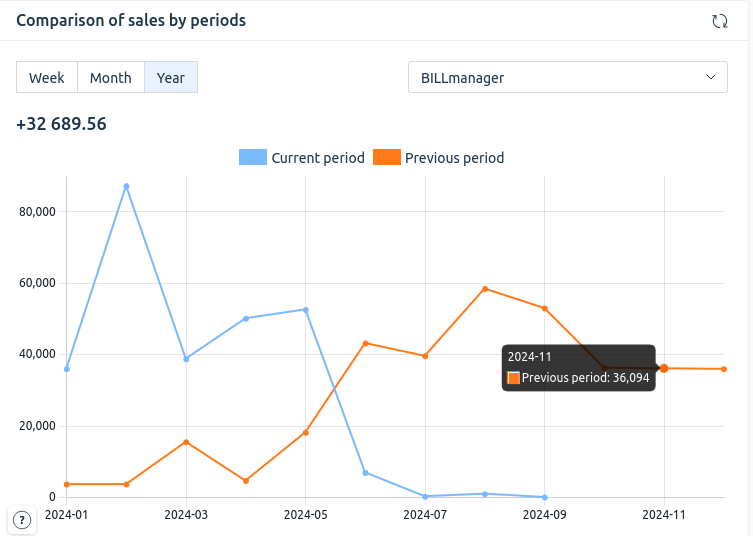
Comparison of sales by periods widget
The widget helps to compare expenses of the selected period relative to a similar period in the past. User can select a time period: week, month or year. The beginning of the period is equal to the calendar start of the week (from Monday), month, year. The end of the period is the current day.
Widget allows you to see statistics for a specific provider. The list of providers is available in the drop-down menu in the upper right corner of the widget.
Widget interface
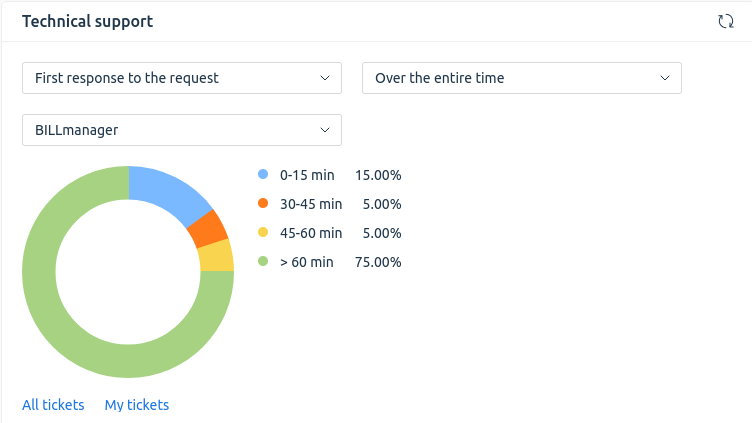
Technical support widget
The widget shows a chart with data on tech support performance for a specific provider:
- first response time;
- overall assessment of technical support work.
The list of providers is available in the drop-down menu.
Statistics are available for the current week, month and all time.
For more information, you can go to the Support section via the All tickets and My tickets links at the bottom of the widget.
Widget interface
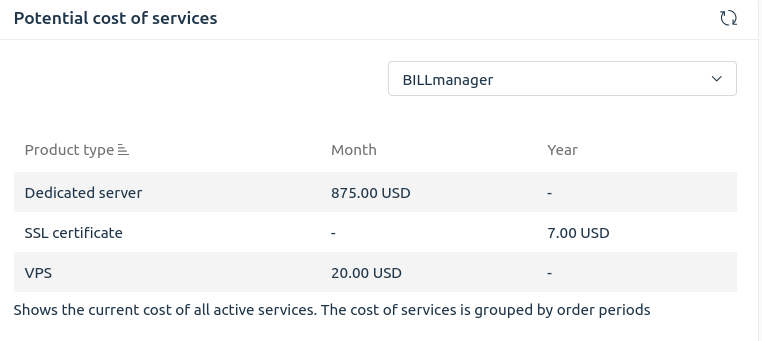
Potential cost of services widget
The widget contains information about subscribed services and allows you to see the total cost of these services.
The data are grouped by active product type and value for the period:
- day;
- month;
- year;
- lifetime services — services for which the client pays once.
Widget shows a view of statistics for a specific provider. The list of providers is available in the drop-down menu in the upper right part of the widget.
Widget interface
Services as of date widget
The widget displays services by product type for the last 13 months. For example, September 2024 will display statistics from September 2023 to September 2024 inclusive. You can view statistics by the following service statuses:
- active;
- deleted;
- ordered;
- suspended;
- in progress.
To switch between service , use the buttons at the top of the widget.
Widget shows a view of statistics for a specific provider. The list of providers is available in the drop-down menu in the upper right part of the widget.
By default, the widget displays information about all types of services. To exclude an indicator from the statistics, click on its name. Excluded indicators will be displayed strikethrough. To restore the excluded indicator, click on its name again.
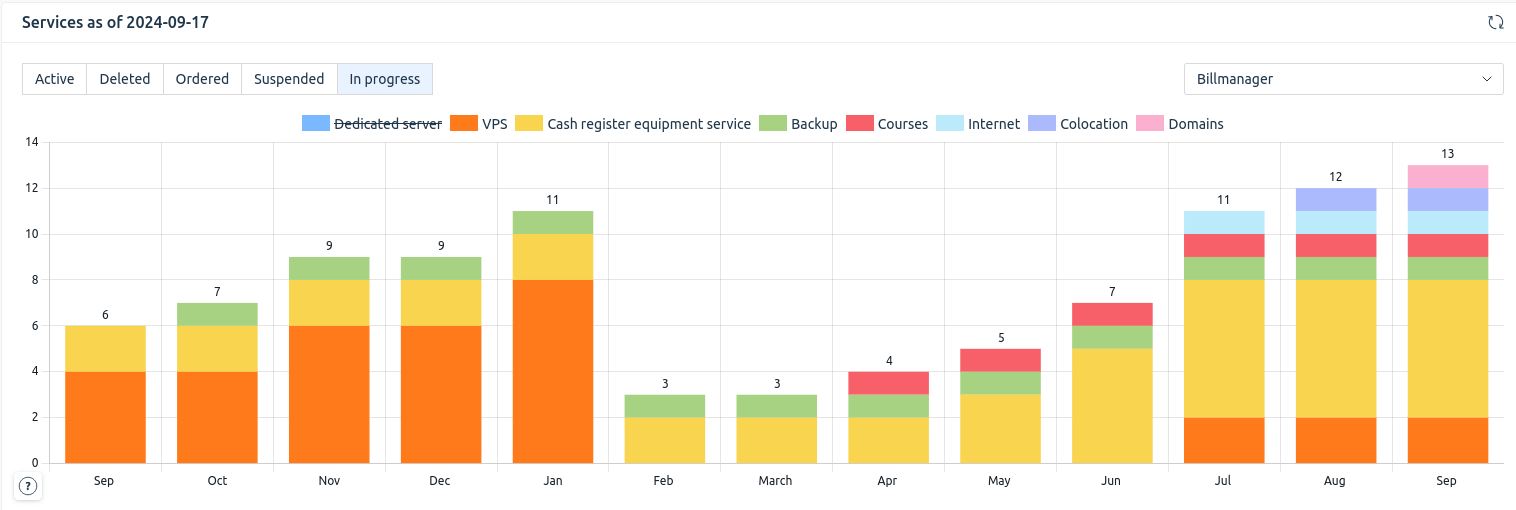
Widget interface
Tasks and operations widget
The widget displays information about tasks and operations.
The following parameters are displayed for tasks:
- task type;
- service or product number;
- client (identified by name and e-mail address);
- operation;
- task creation date;
- task status;
- action (possibility to change data).
The following parameters are displayed for operations:
- description;
- service or product number;
- client (identified by name and e-mail address);
- operation creation date;
- task;
- operation status (automatic or manual processing);
- action (possibility to change data).
Administrators can manually change the data. To do this, click Edit in column Action.
By default, the widget displays five most recent tasks and operations. To see the full list, click All tasks or All operations.

Widget interface. Tasks

Widget interface. Operations
Reselling service balance widget
The widget displays a balance table for resale services.
Information is presented in columns:
- processing module;
- account balance in the currency entered for this module;
- balance information update time (to the precision of a second).
If for some reason the balance is unavailable, an  icon will appear in the Balance column. When you hover over it, a pop-up message with the reason will be displayed.
For example: “Failed to get the account balance infornation. Reason: <reason>”
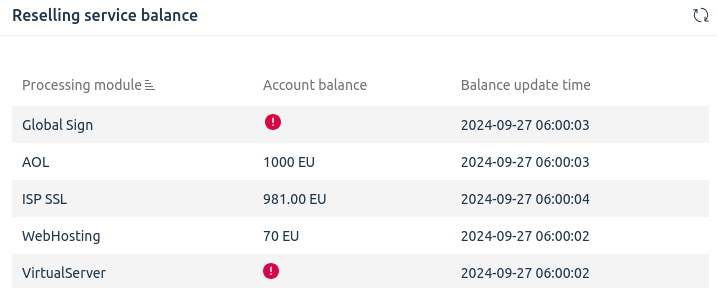
Widget interface
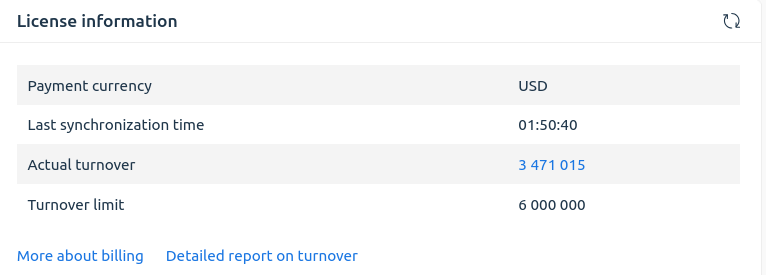
License information widget
BILLmanager generates a report on the turnover within the license. For more information, see the article BILLmanager Hosting&Cloud tariff. The widget displays:
- payment currency;
- last synchronisation time;
- actual turnover;
- set turnover limit.
The bottom part contains links for:
- More about billing — a reference on how tariffing is calculated;
- Detailed report on turnover.
Widget interface
Related articles:
