The article describes how to work with the module and create new dashboards based on existing ones.
Module interface
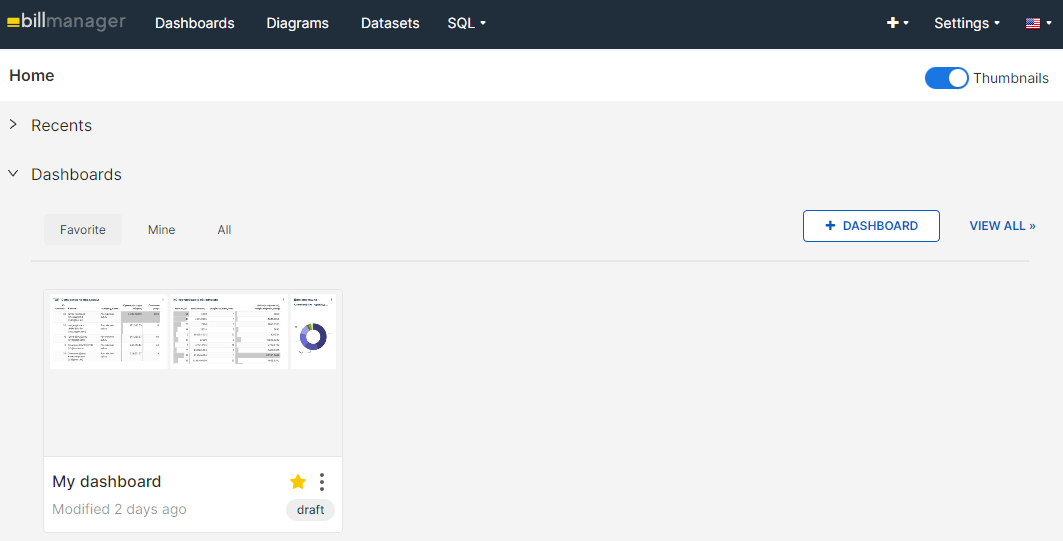
The Home page contains Recent, Dashboards, Charts and Saved SQL queries blocks.
The information in the Recent block is grouped by user actions:
- Viewed;
- Edited;
- Created.
The data is organized by date and time, starting with the most recent and ending with older ones.
The information in the remaining blocks is organized into groups:
- Favorite — items marked with
 ;
; - Mine — items created by the current user;
- All — the first five items recently accessed by the user.
The blocks contain buttons:
- View all — go to the appropriate section of the module;
- +Dashboard, +Charts or +SQL query — go to the creation of items for data visualization.
To change the display of item thumbnails on the home page, use the Thumbnails  switch.

In the top menu, there are buttons for quick navigation through the module sections:
- Dashboards;
- Diagrams;
- Datasets;
- SQL:
-
- SQL editor;
- Saved queries;
- Query history.
Click Settings to access the security, data, and profile management sections.
To return to the home page, click on the logo in the upper left corner of the page.
Dashboards
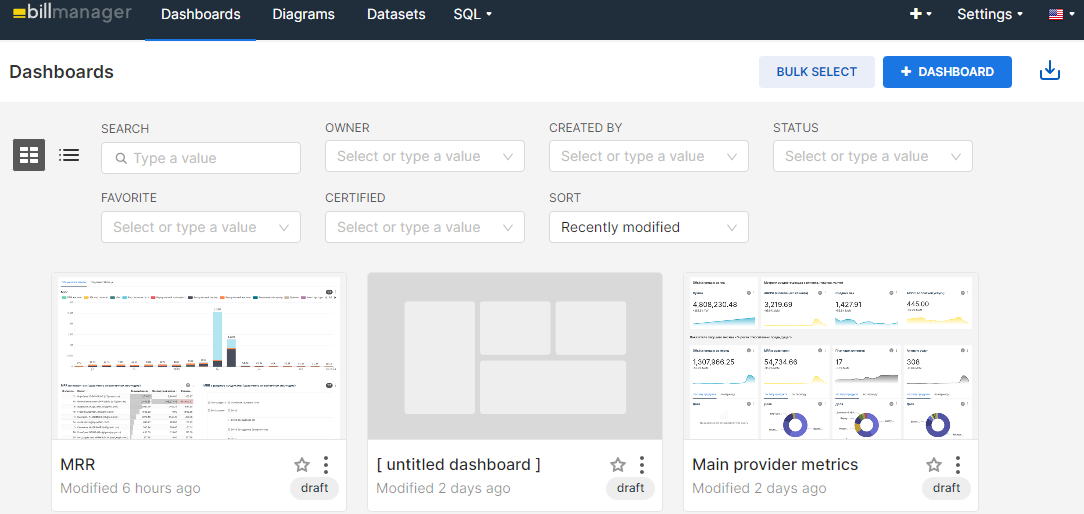
Dashboards are information panels that present data and their graphical display.
The module contains several preset dashboards, which you can use immediately after installing it.
Actions with dashboards:
-
edit dashboard properties. Here you can change the basic information about the dashboard;
Editing an object in the More details section may cause the dashboard to malfunction. - export a dashboard, where a zip-archive with the yaml files will be downloaded;
- delete a dashboard, confirmation will be required;
- add to favorites
 ;
; - multiple selection to delete or export several selected dashboards;
- import dashboards
 to the BI analytics panel.
You can customize the display of dashboards:
- tile with the
 button;
 - table using the
 button.
You can customize the filter for easier viewing and searching of dashboards by using the fields:
- Name — enter all or part of the dashboard name;
- Status — select the status of the dashboard, for example, Draft, or Published;
- Owner — select the user who created the dashboard;
- Favorites — select to filter:
-
- Yes — dashboards are in favorites;
- No — dashboards not in favorites;
- Approved — select approved/unapproved dashboards;
- Modified by — select all dashboards modified by the user.
You can customize the sorting:
- Alphabetical;
- Recently modified — dashboards modified later will be first;
- Modified long ago — first will be dashboards modified earlier.
You can customize the sorting and filter for easier viewing and searching of dashboards.

Working with the dashboard
On the dashboard, you can:
- explore the contents of charts;
- edit and manage the dashboard;
- customize the data filter for display in charts.
Hover your cursor over the required item to see the information the charts contain. Each chart has a
 menu with available actions:
- Forced refresh the data of the selected chart;
- switch to Full-screen mode of the chart view;
- Edit chart — switch to the chart builder;
- Cross-filter scoping — apply filters from one visual element (for example, a table row or a pie chart sector) to all relevant visualizations on the dashboard;
- View query in the window with the query code for the selected chart;
- View as table — see the tabular data of the selected chart. To copy the table to the clipboard, click the
 icon;
icon; - Share:
-
- copy permalink to clipboard — copy the link to the chart;
- send the chart by email;
- Download:
-
- export the chart as CSV;
- export the chart to Excel — the data will be saved as a table;
- save the chart as a JPEG image.
Actions available in the dashboard
 menu:
menu:- Refresh dashboard — update the data of charts and reports on the dashboard;
- enter Full-screen mode — disable the top menu from the BILLmanager interface;
- Save as — copy the dashboard to create new ones based on it. Read more in Creating the dashboard:
- Overwrite dashboard — activate the option to write changes to the current dashboard;
- Save:
- Export to PDF — upload data in PDF format;
- Download as — download file in JPG format;
- Share — copy the link to the dashboard to the clipboard or send it by email;
- Set auto-refresh interval — set the interval of data update on the dashboard for the time of the current session.
Creating the dashboard
To create a dashboard, a builder without code is used.
To create a dashboard based on a preset:
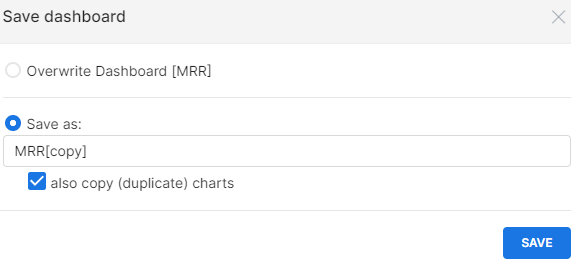
- Open the required dashboard → in the upper panel click the
 icon → select Save as:
 -
- Enable the Save as option to create a new dashboard.
- Specify the name of the new dashboard. By default, the panel adds
[copy]to the dashboard name. - Enable the also copy charts option to copy the same charts and reports to the new dashboard.
- Click Save. You will be redirected to the created copy of the dashboard.

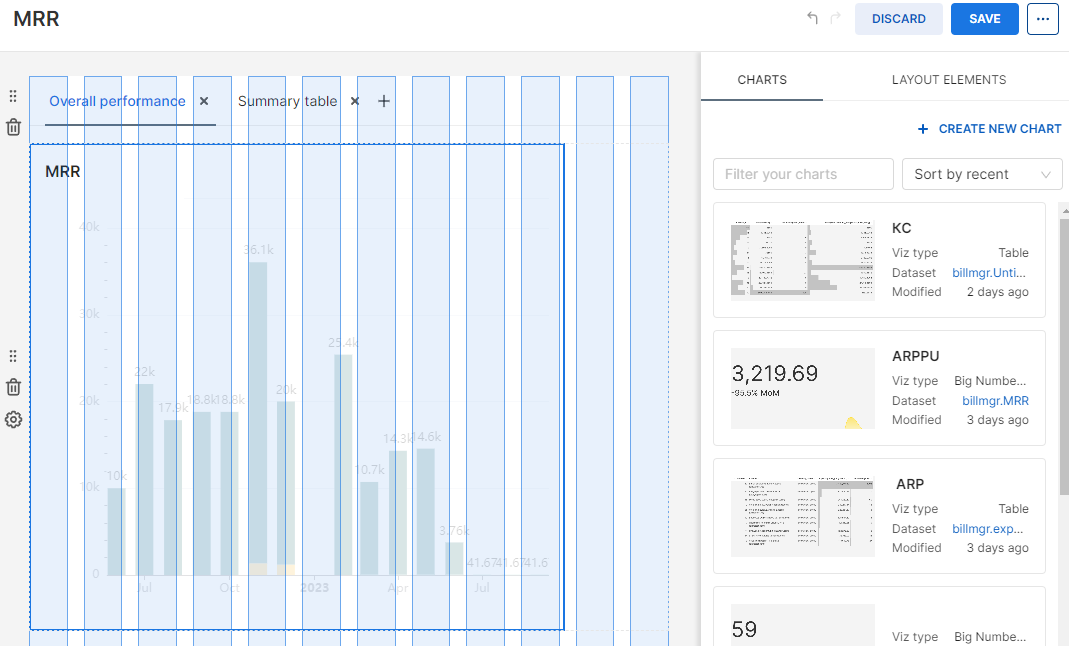
- Click Edit dashboard.
- Select the data and charts to display and drag them to the dashboard.
If there is no suitable chart in the list, you can Create new chart.
To customize the layout, go to the Layout Elements tab and drag the required blocks onto the dashboard.
Pull the edge of the item to resize it. - Click Save to save the changes.

For more information on creating a dashboard from scratch and setting up filters, see the Apache Superset documentation.
 En
En
 Es
Es